Free editable T Chart template to help you understand data quickly. Many different formats are available so that you can choose the one that helps you the most.
What is a T Chart?
A T-Chart is a graphic display that compares two aspects of a situation or two different options (such as the pros and cons, strengths and weaknesses, and advantages and disadvantages). When you lay out both sides next to each other in a T-Chart, you can see both sides at a glance. This can help you weigh each side against the other and choose the side that is dominant. This will give you the solution to your problem.
A t chart can be used in many different situations, but the most common use is to make a pros and cons list.
Each t-chart template has two columns. The number of rows depends on the problem at hand. It can be used to compare things in order to determine the pros and cons of each. For example, when comparing two colleges or whether or not to go into a particular relationship.
T charts are easier for data visualization because you can see what information goes into each side of the argument or what information belongs on which side of the table.
See also pros and cons list.
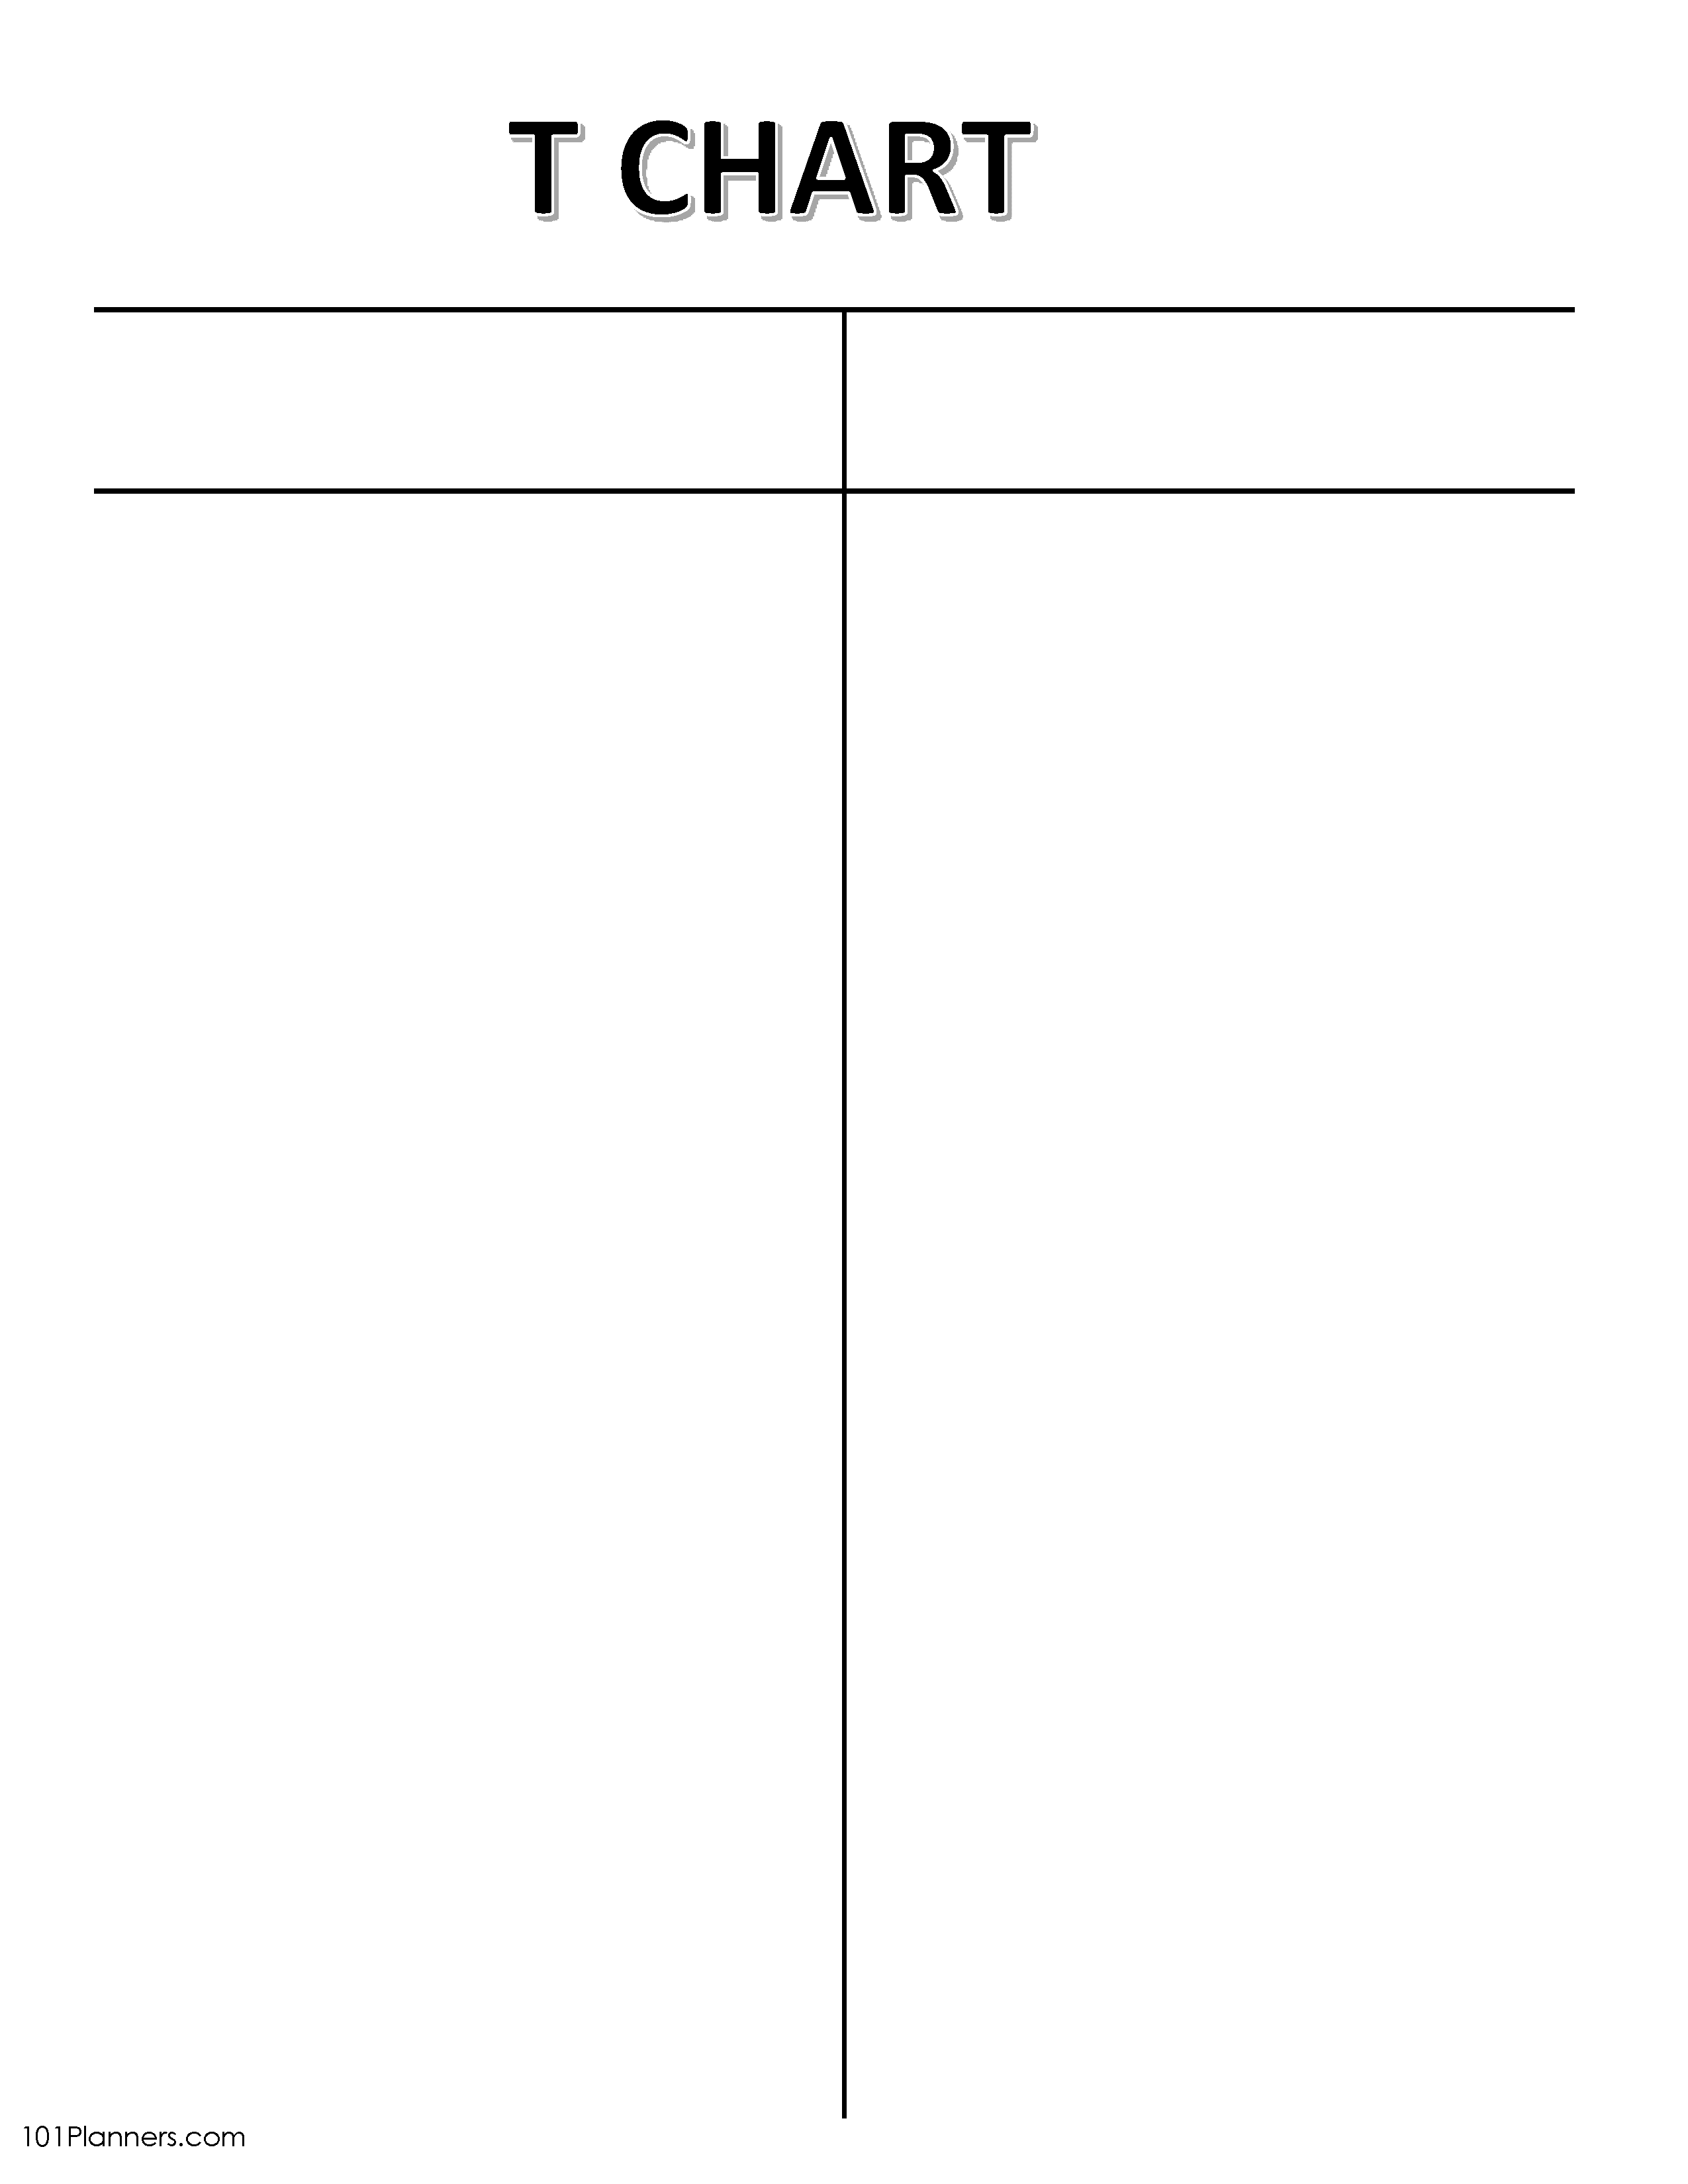
T Chart Template
This T chart template shows the problems and their potential solutions.
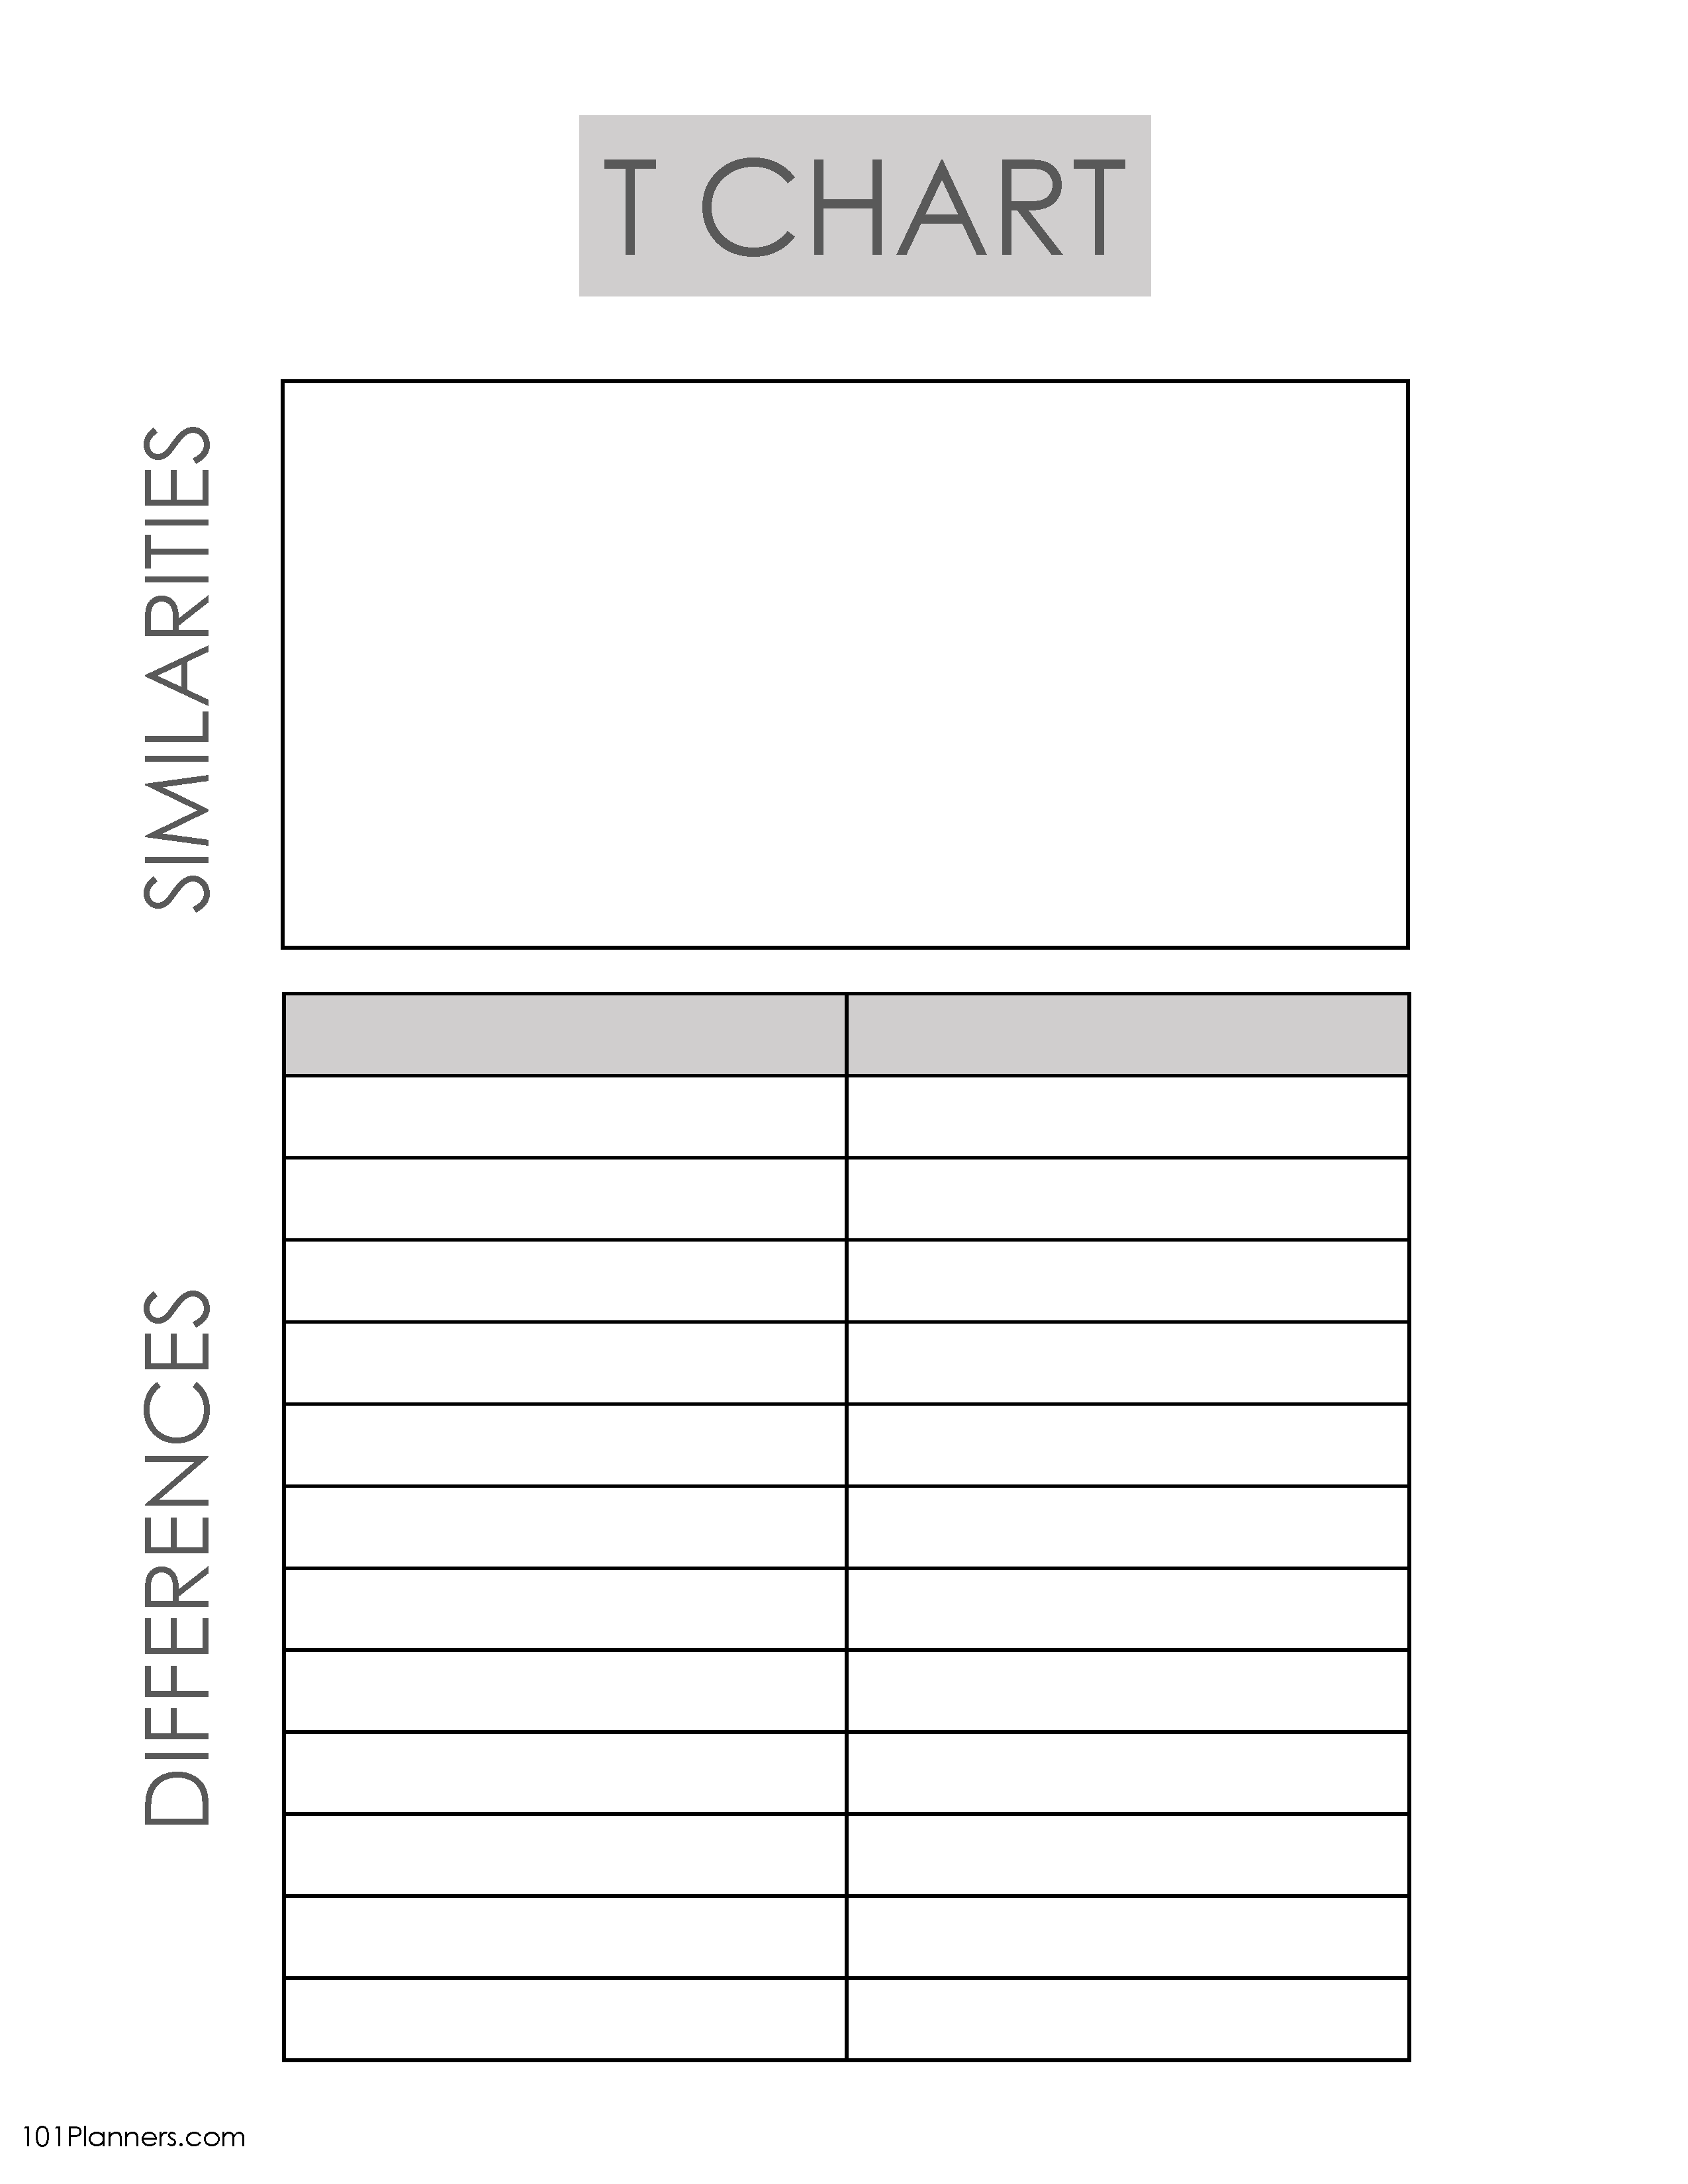
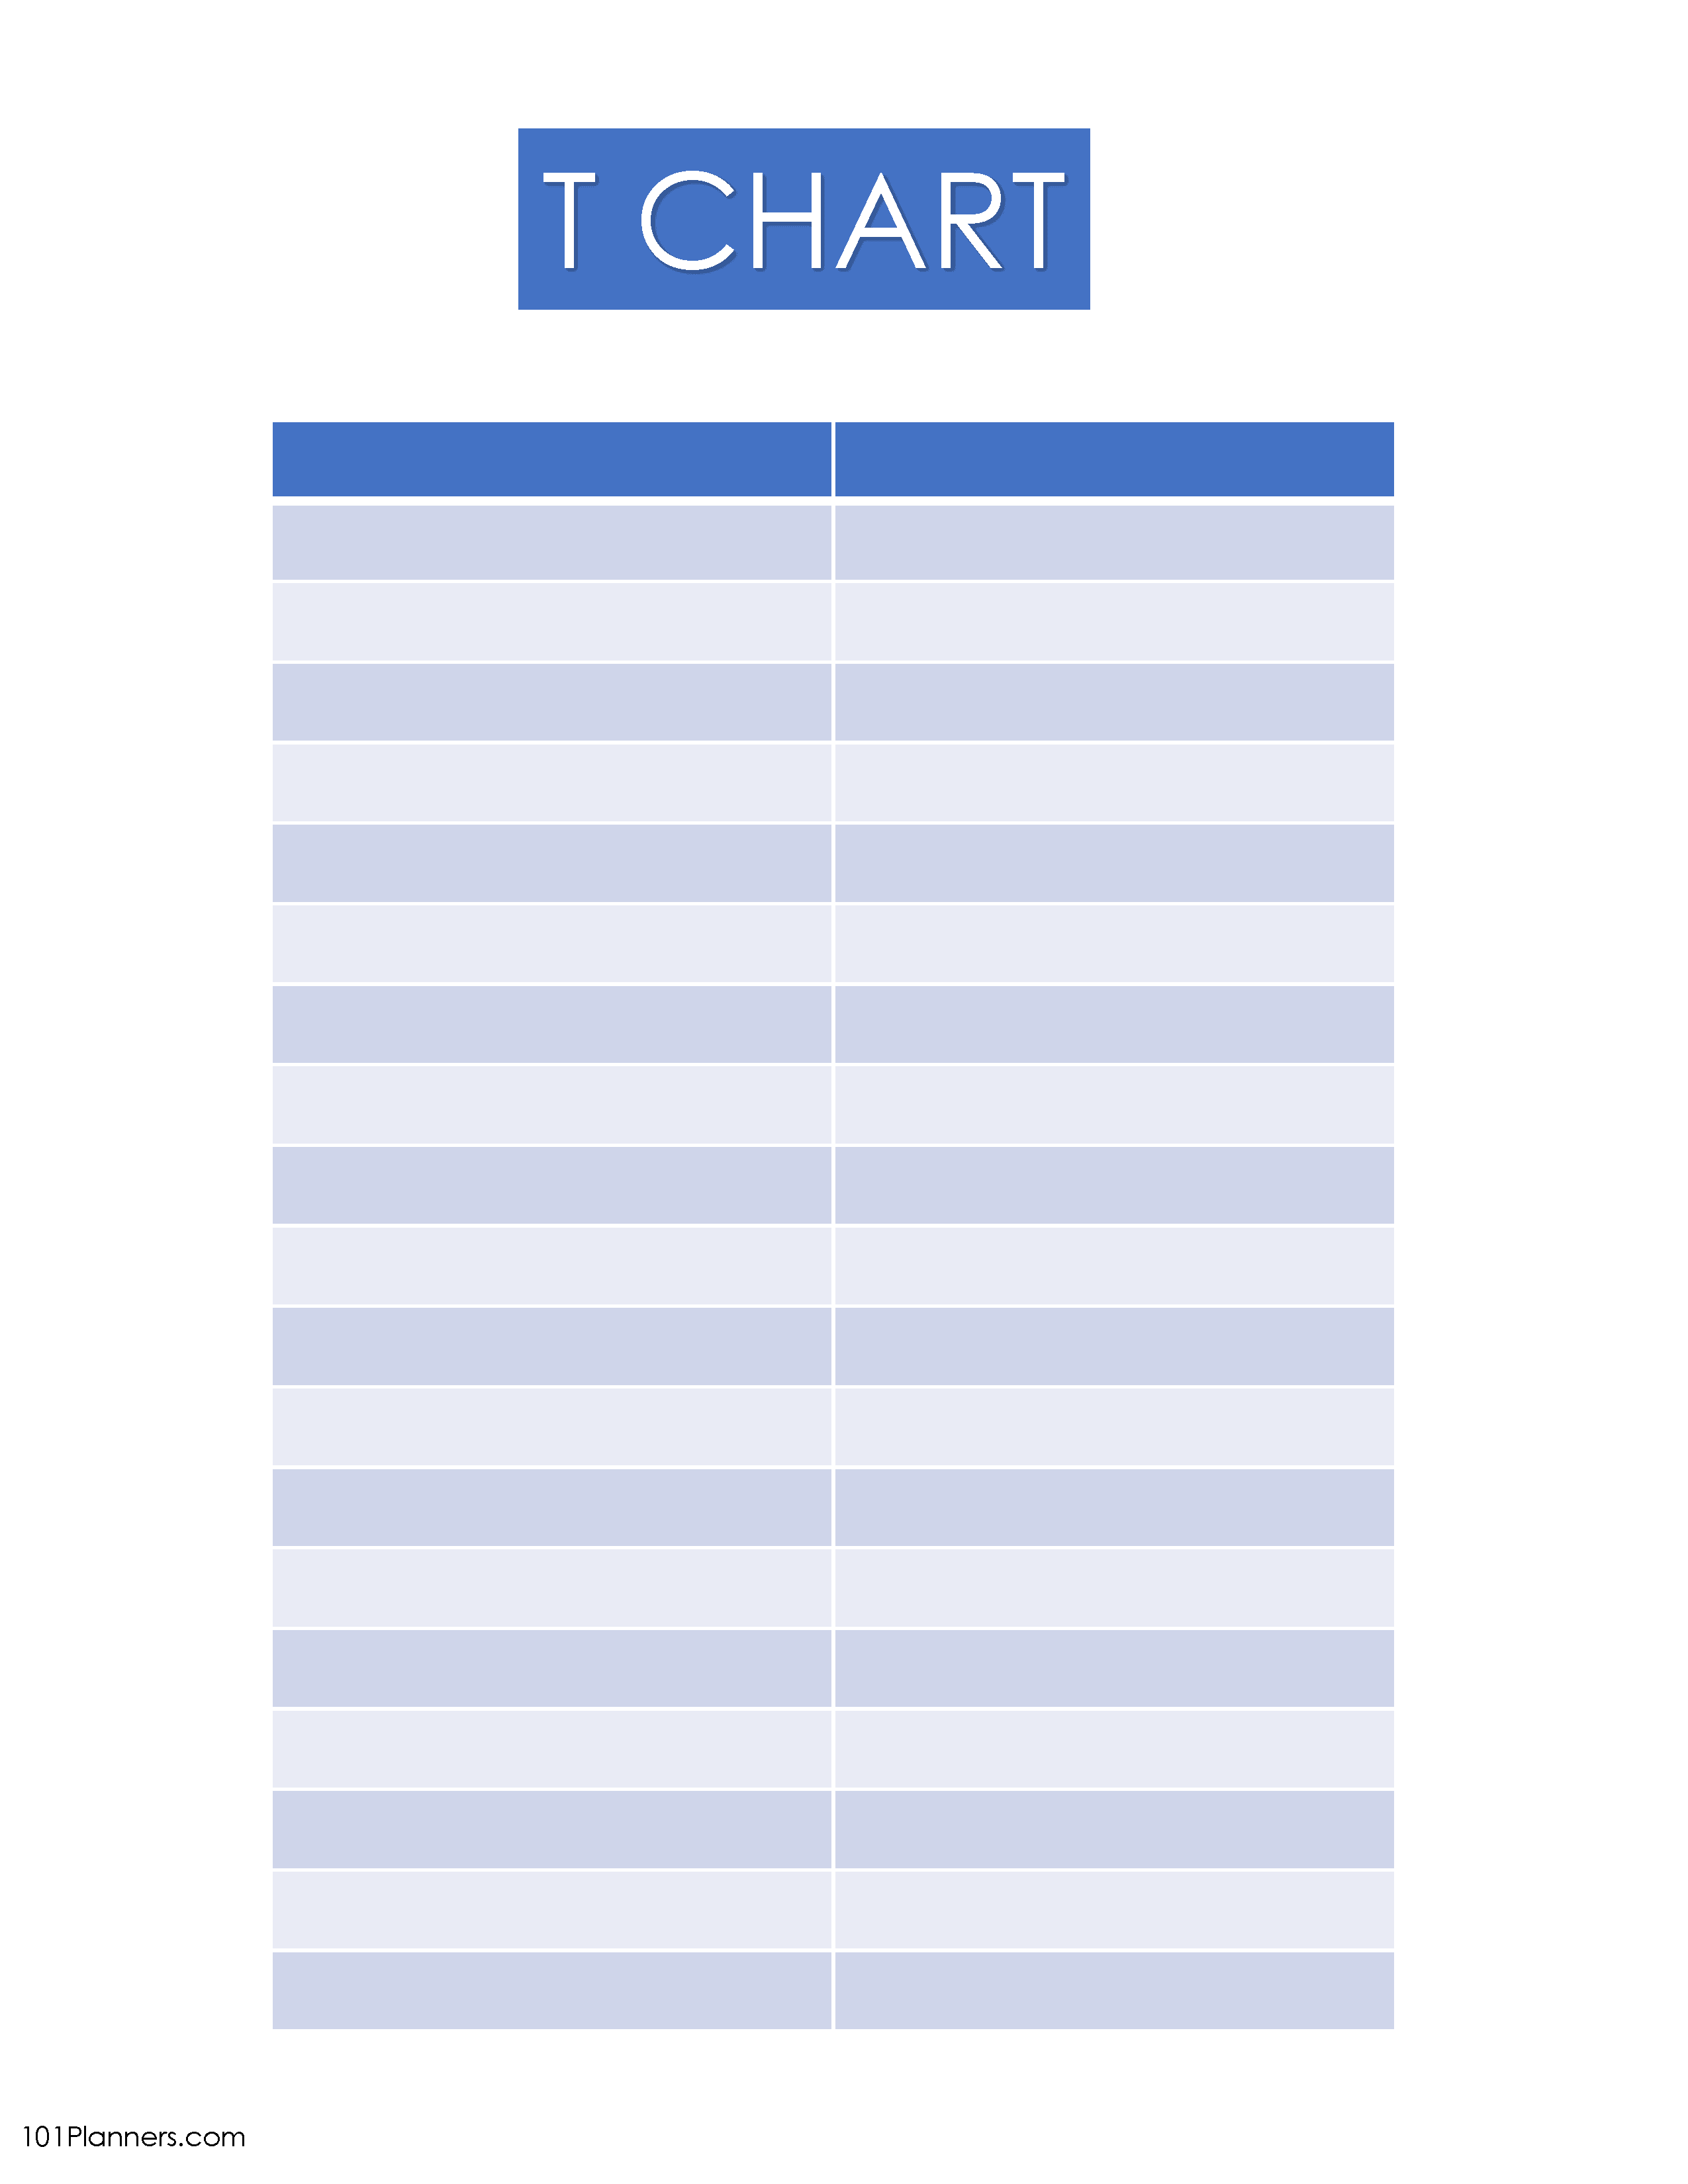
You can change the titles to anything you need such as pros vs cons, advantages vs disadvantages, facts vs opinions, verb vs noun, advantages vs disadvantages, strengths vs weaknesses, mixtures vs solutions, before and after, true or false, causes and effects, the possibilities are endless.
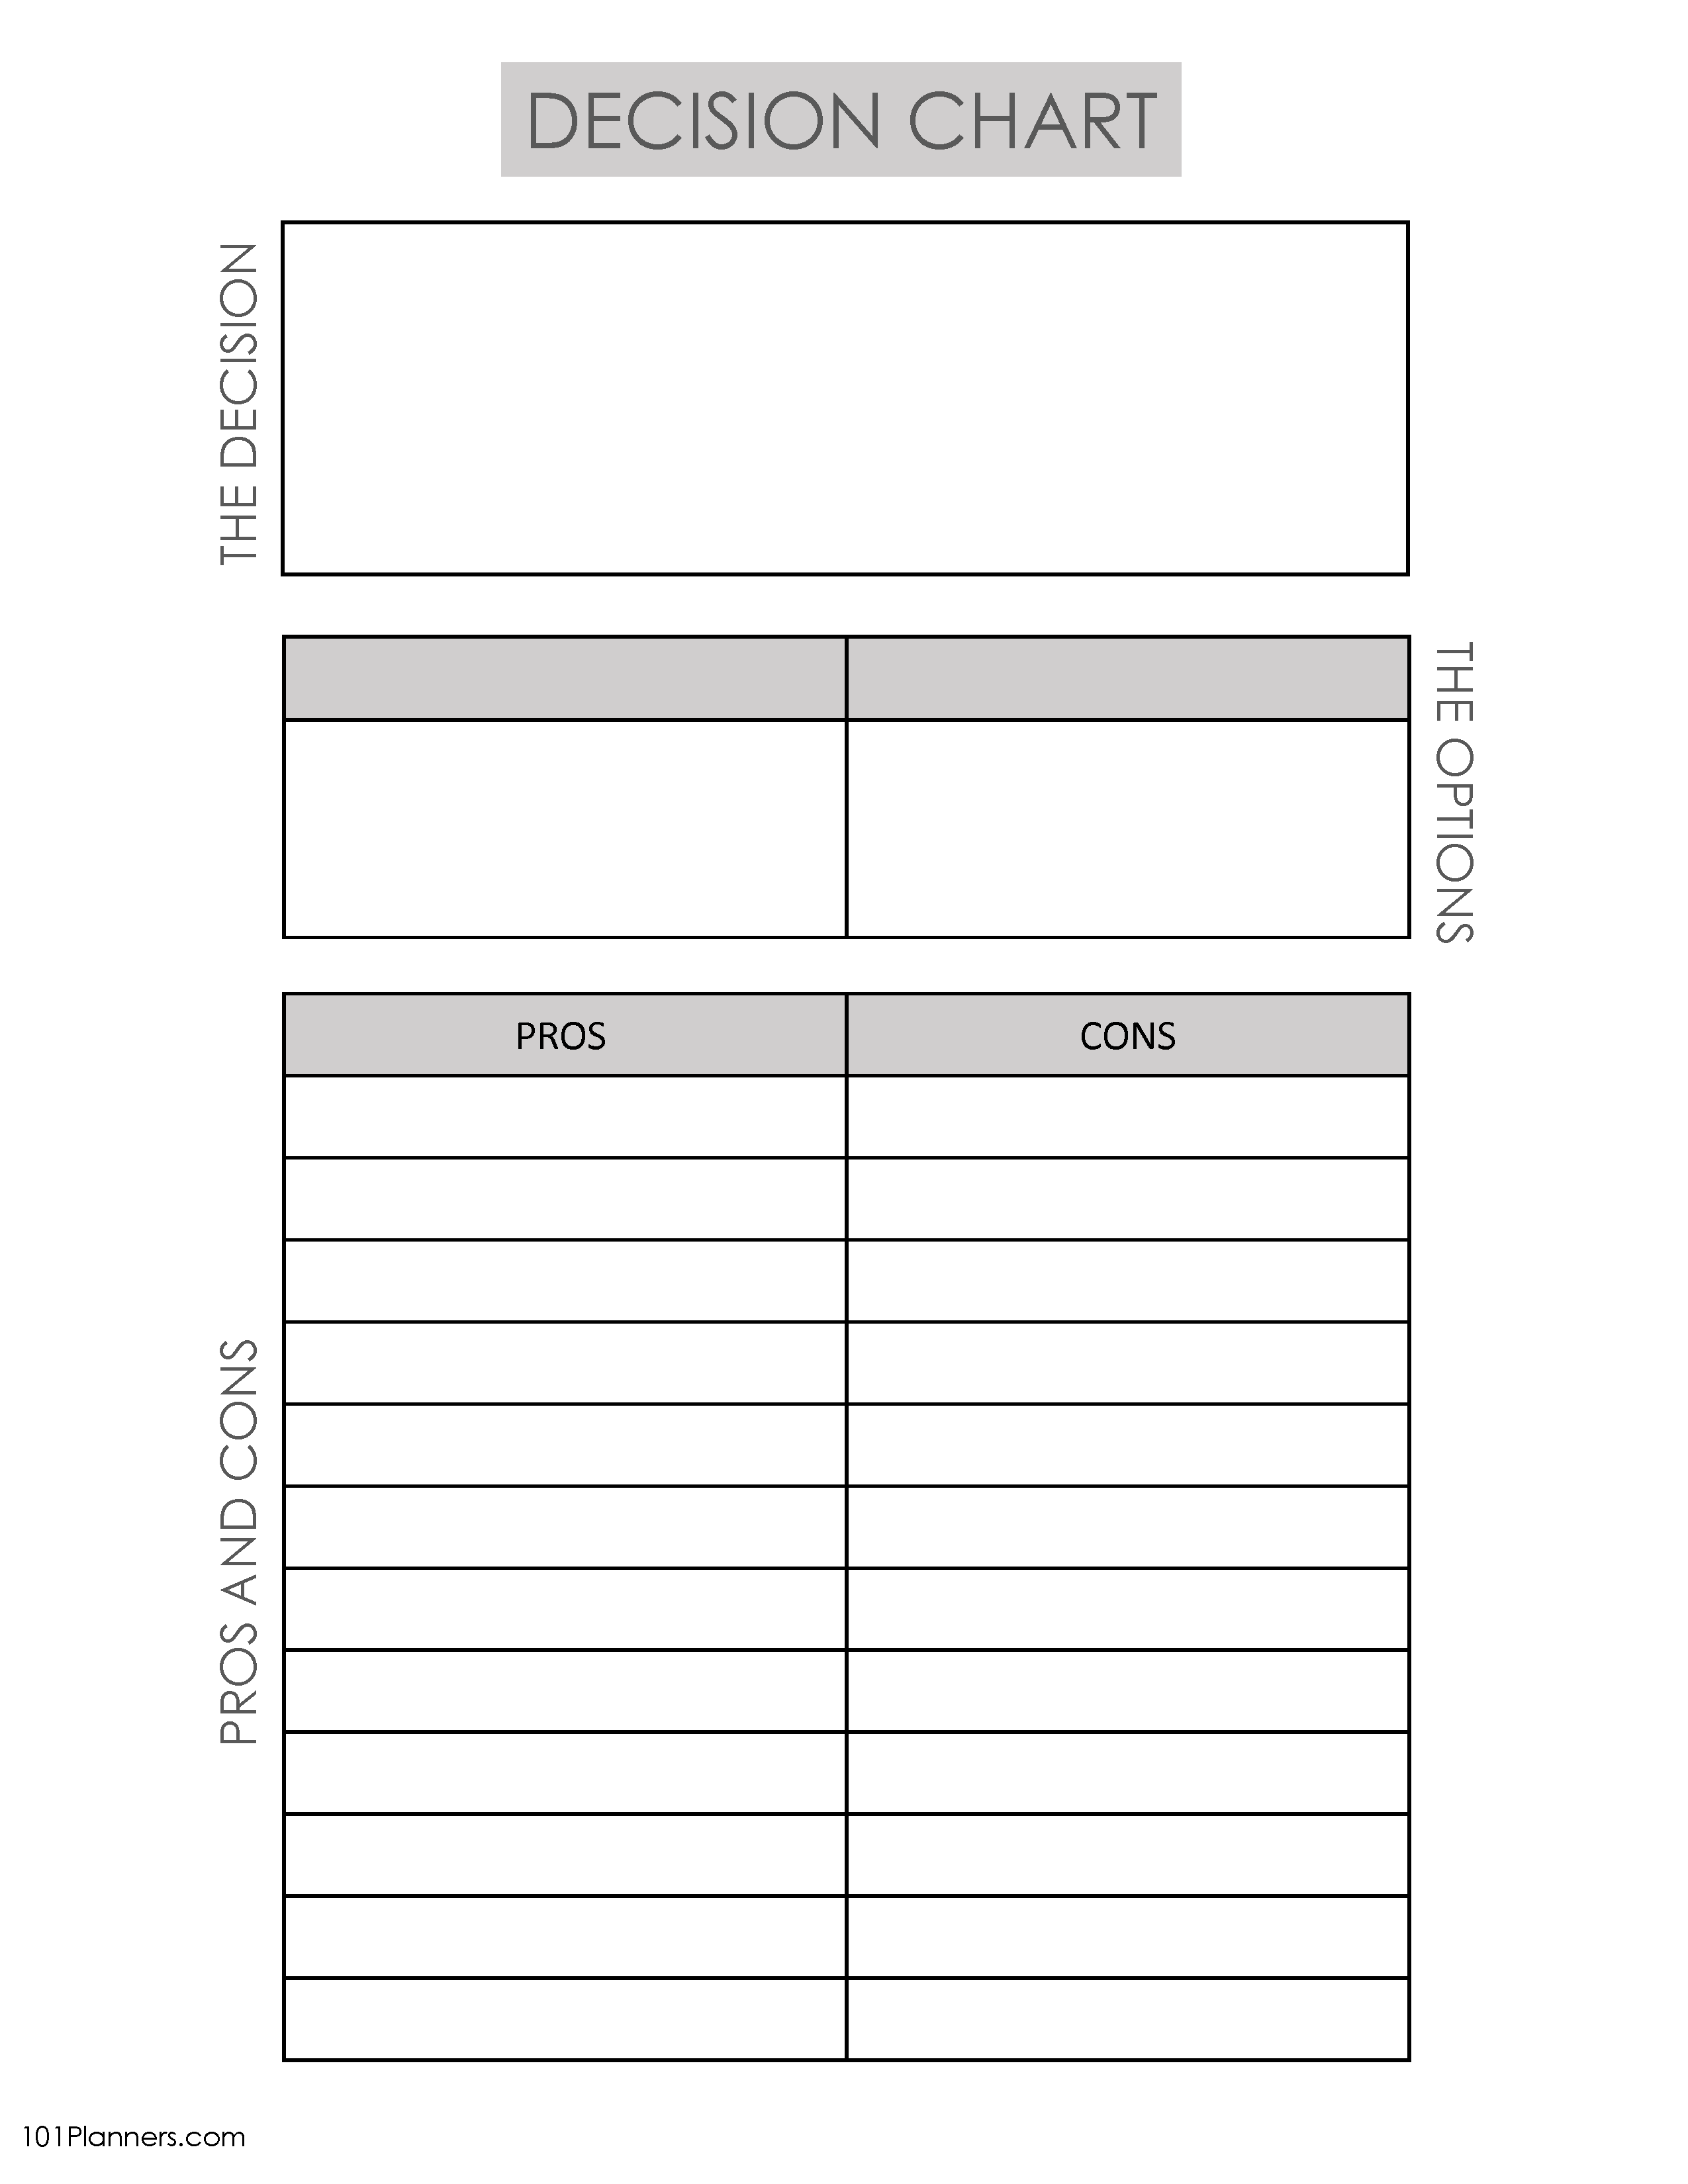
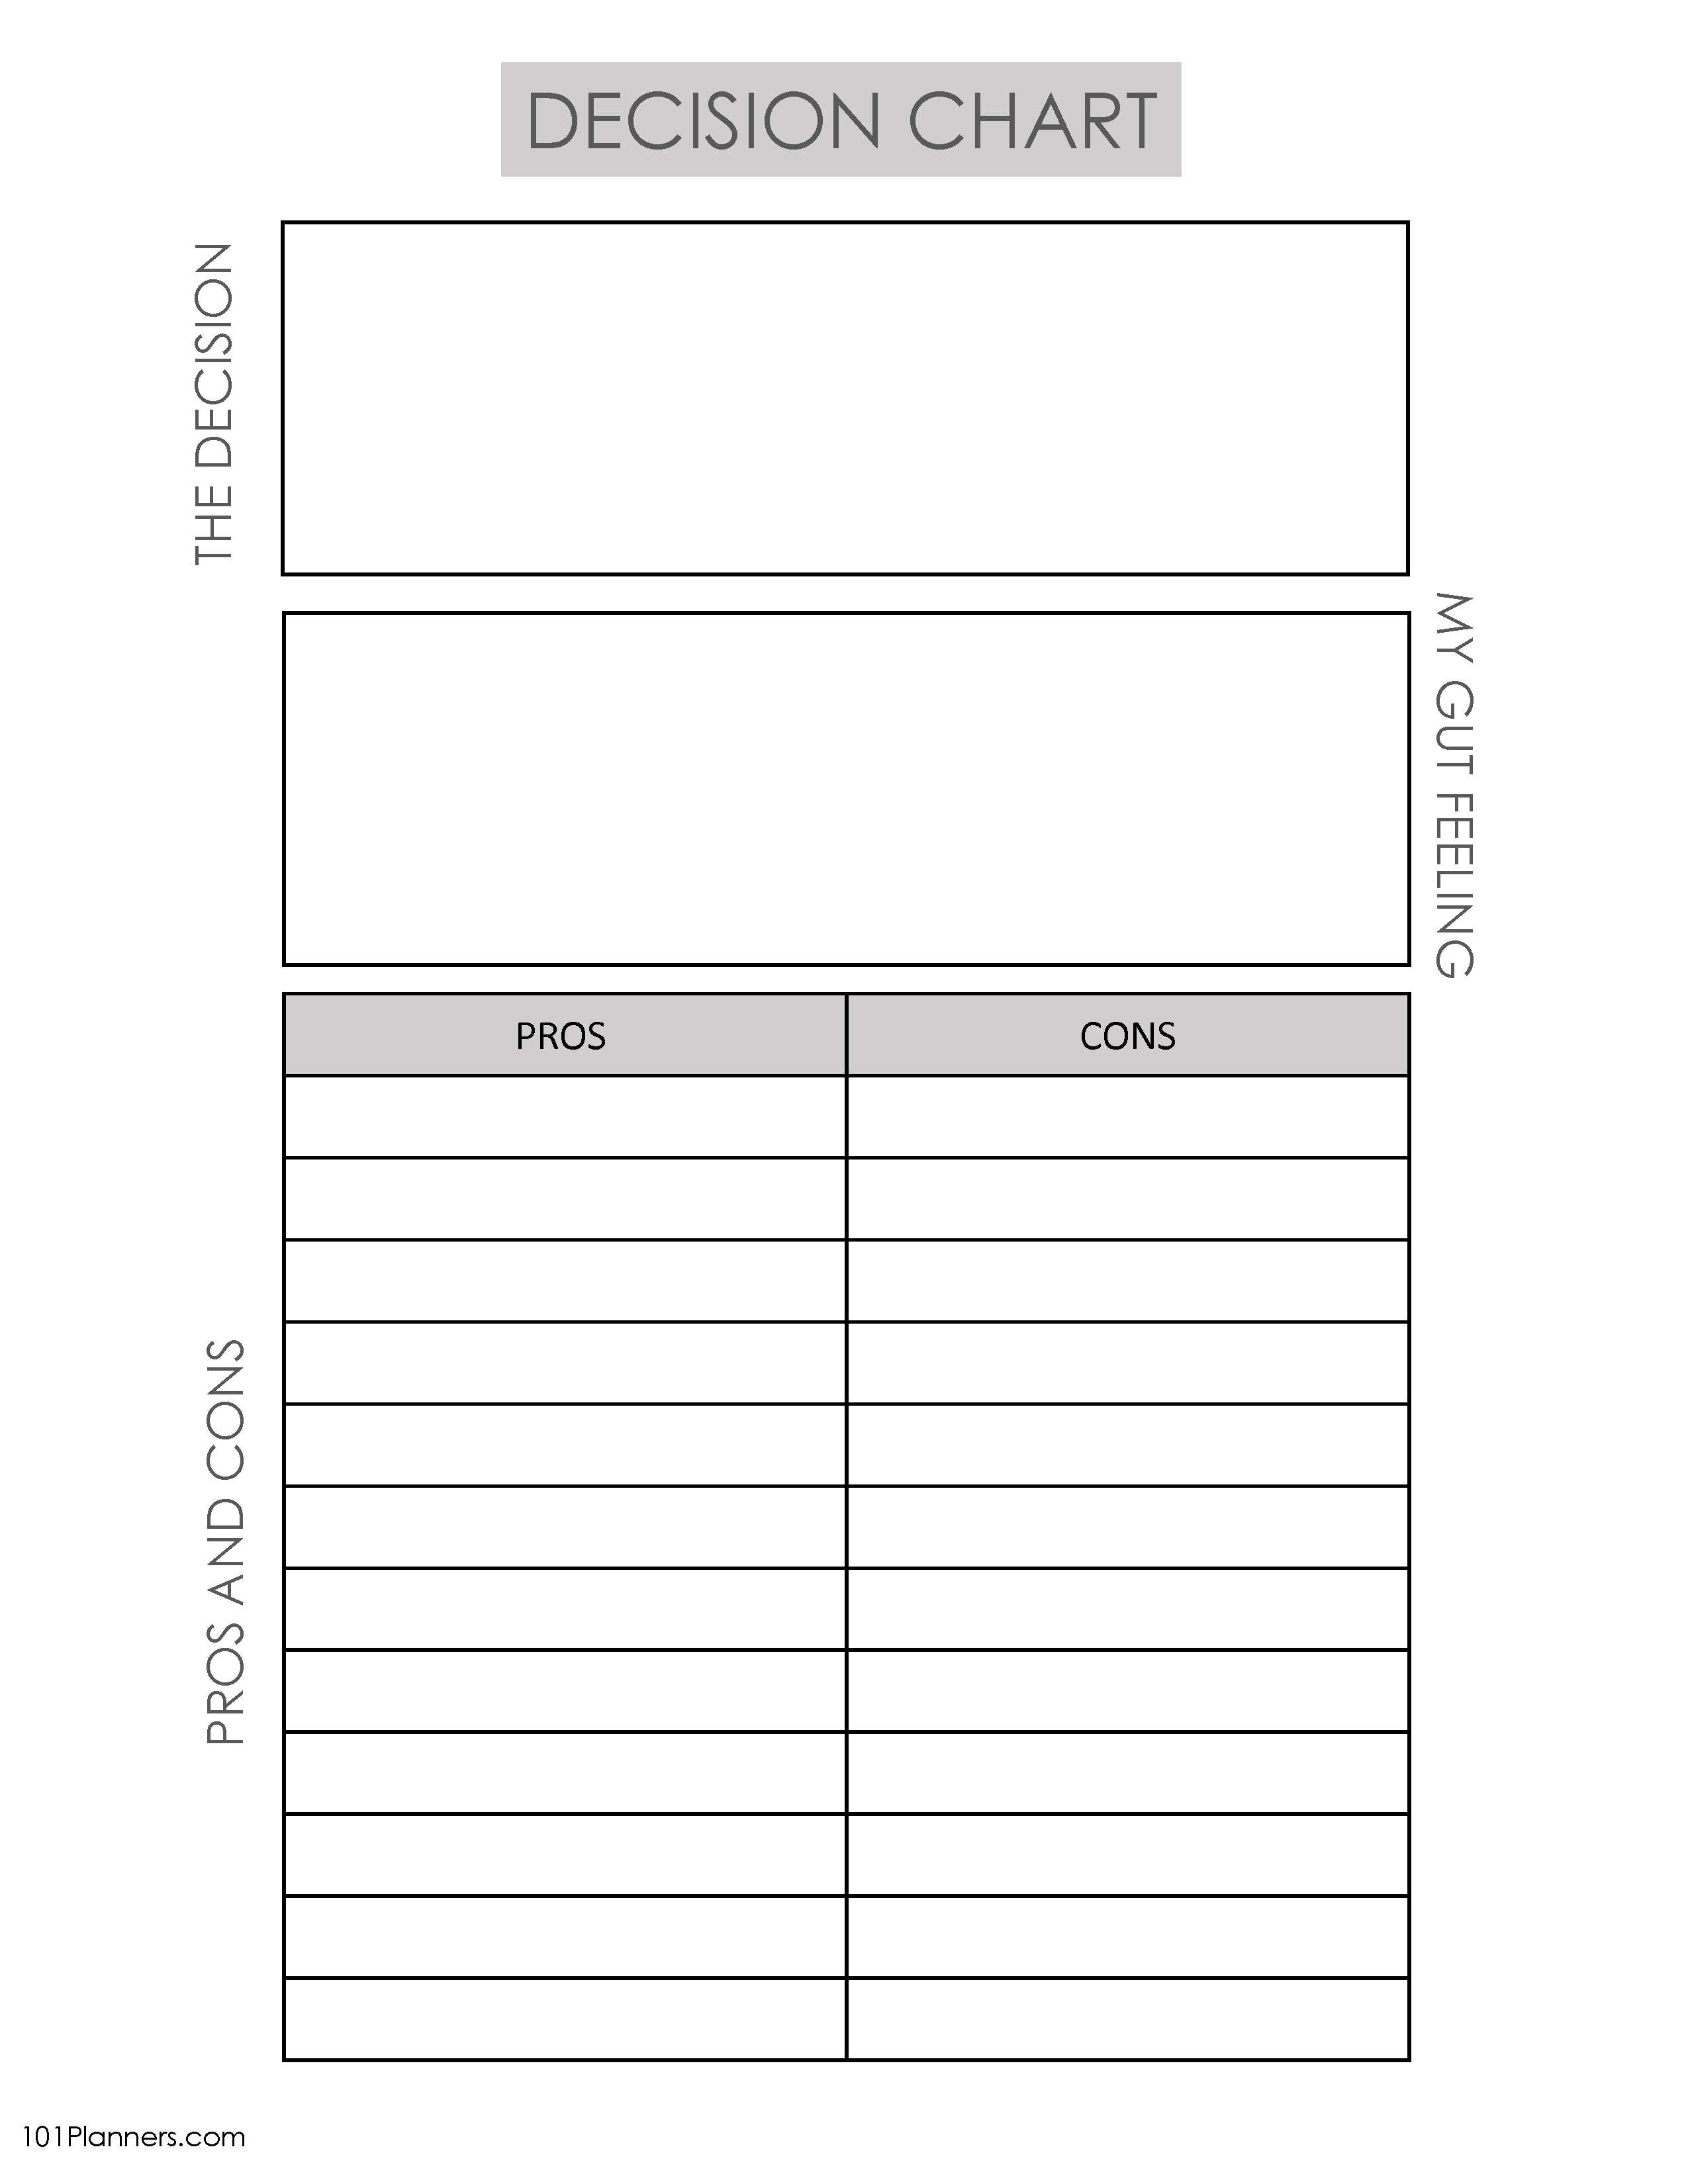
Decision Chart
A decision-making chart will help you present the problem and the pros and cons of the decision. I have added a section for your gut feeling, which I think is important particularly when you trust your instincts.
T Chart Example
Should I move to a new house?
Stay in my home
- Cheaper
- I’m used to the neighborhood
- Less hassle
Move to a new home
- Closer to work
- Better neighborhood
- Nicer house
How to make a t chart in Word
- Select the format you want to use.
- Download the MS Word template.
- Edit or add your text.
How to make a t chart on Google Docs
- Select the format you want to use.
- Download the MS Word template.
- Open Google Docs.
- Import the document.
- Edit it with Google Docs.
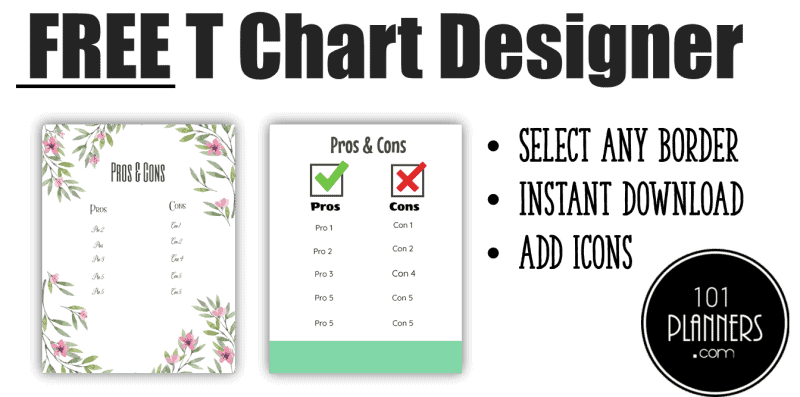
Online T Chart Maker
We offer a free online T chart maker to create graphic T charts such as infographics or posters. Whereas the other charts above are documents, the following option uses our online designer to create pretty T charts with borders, backgrounds, and icons.
FAQ
When is a T Chart Used?
A T-chart is used in a variety of contexts, including:
- Decision Making: To help weigh the pros and cons of different options and make informed decisions.
- Problem Solving: To identify the causes and effects of a problem and develop potential solutions.
- Academic Writing: To organize information and arguments for compare and contrast essays, or to analyze the strengths and weaknesses of a particular subject.
- Classroom Instruction: As a tool for students to organize information, compare and contrast concepts, and analyze information.
- Business Planning: To help evaluate the benefits and drawbacks of a new product or business strategy.
T-charts can be used in various fields and with a wide range of topics, making it a versatile tool for organizing and analyzing information.
How to Create a T Chart?
To make a T-chart, you can follow these steps:
- Draw a vertical line or choose one of the templates above: On a piece of paper or a whiteboard, draw a vertical line that will divide the chart into two columns or use a ready-made template from the selection above.
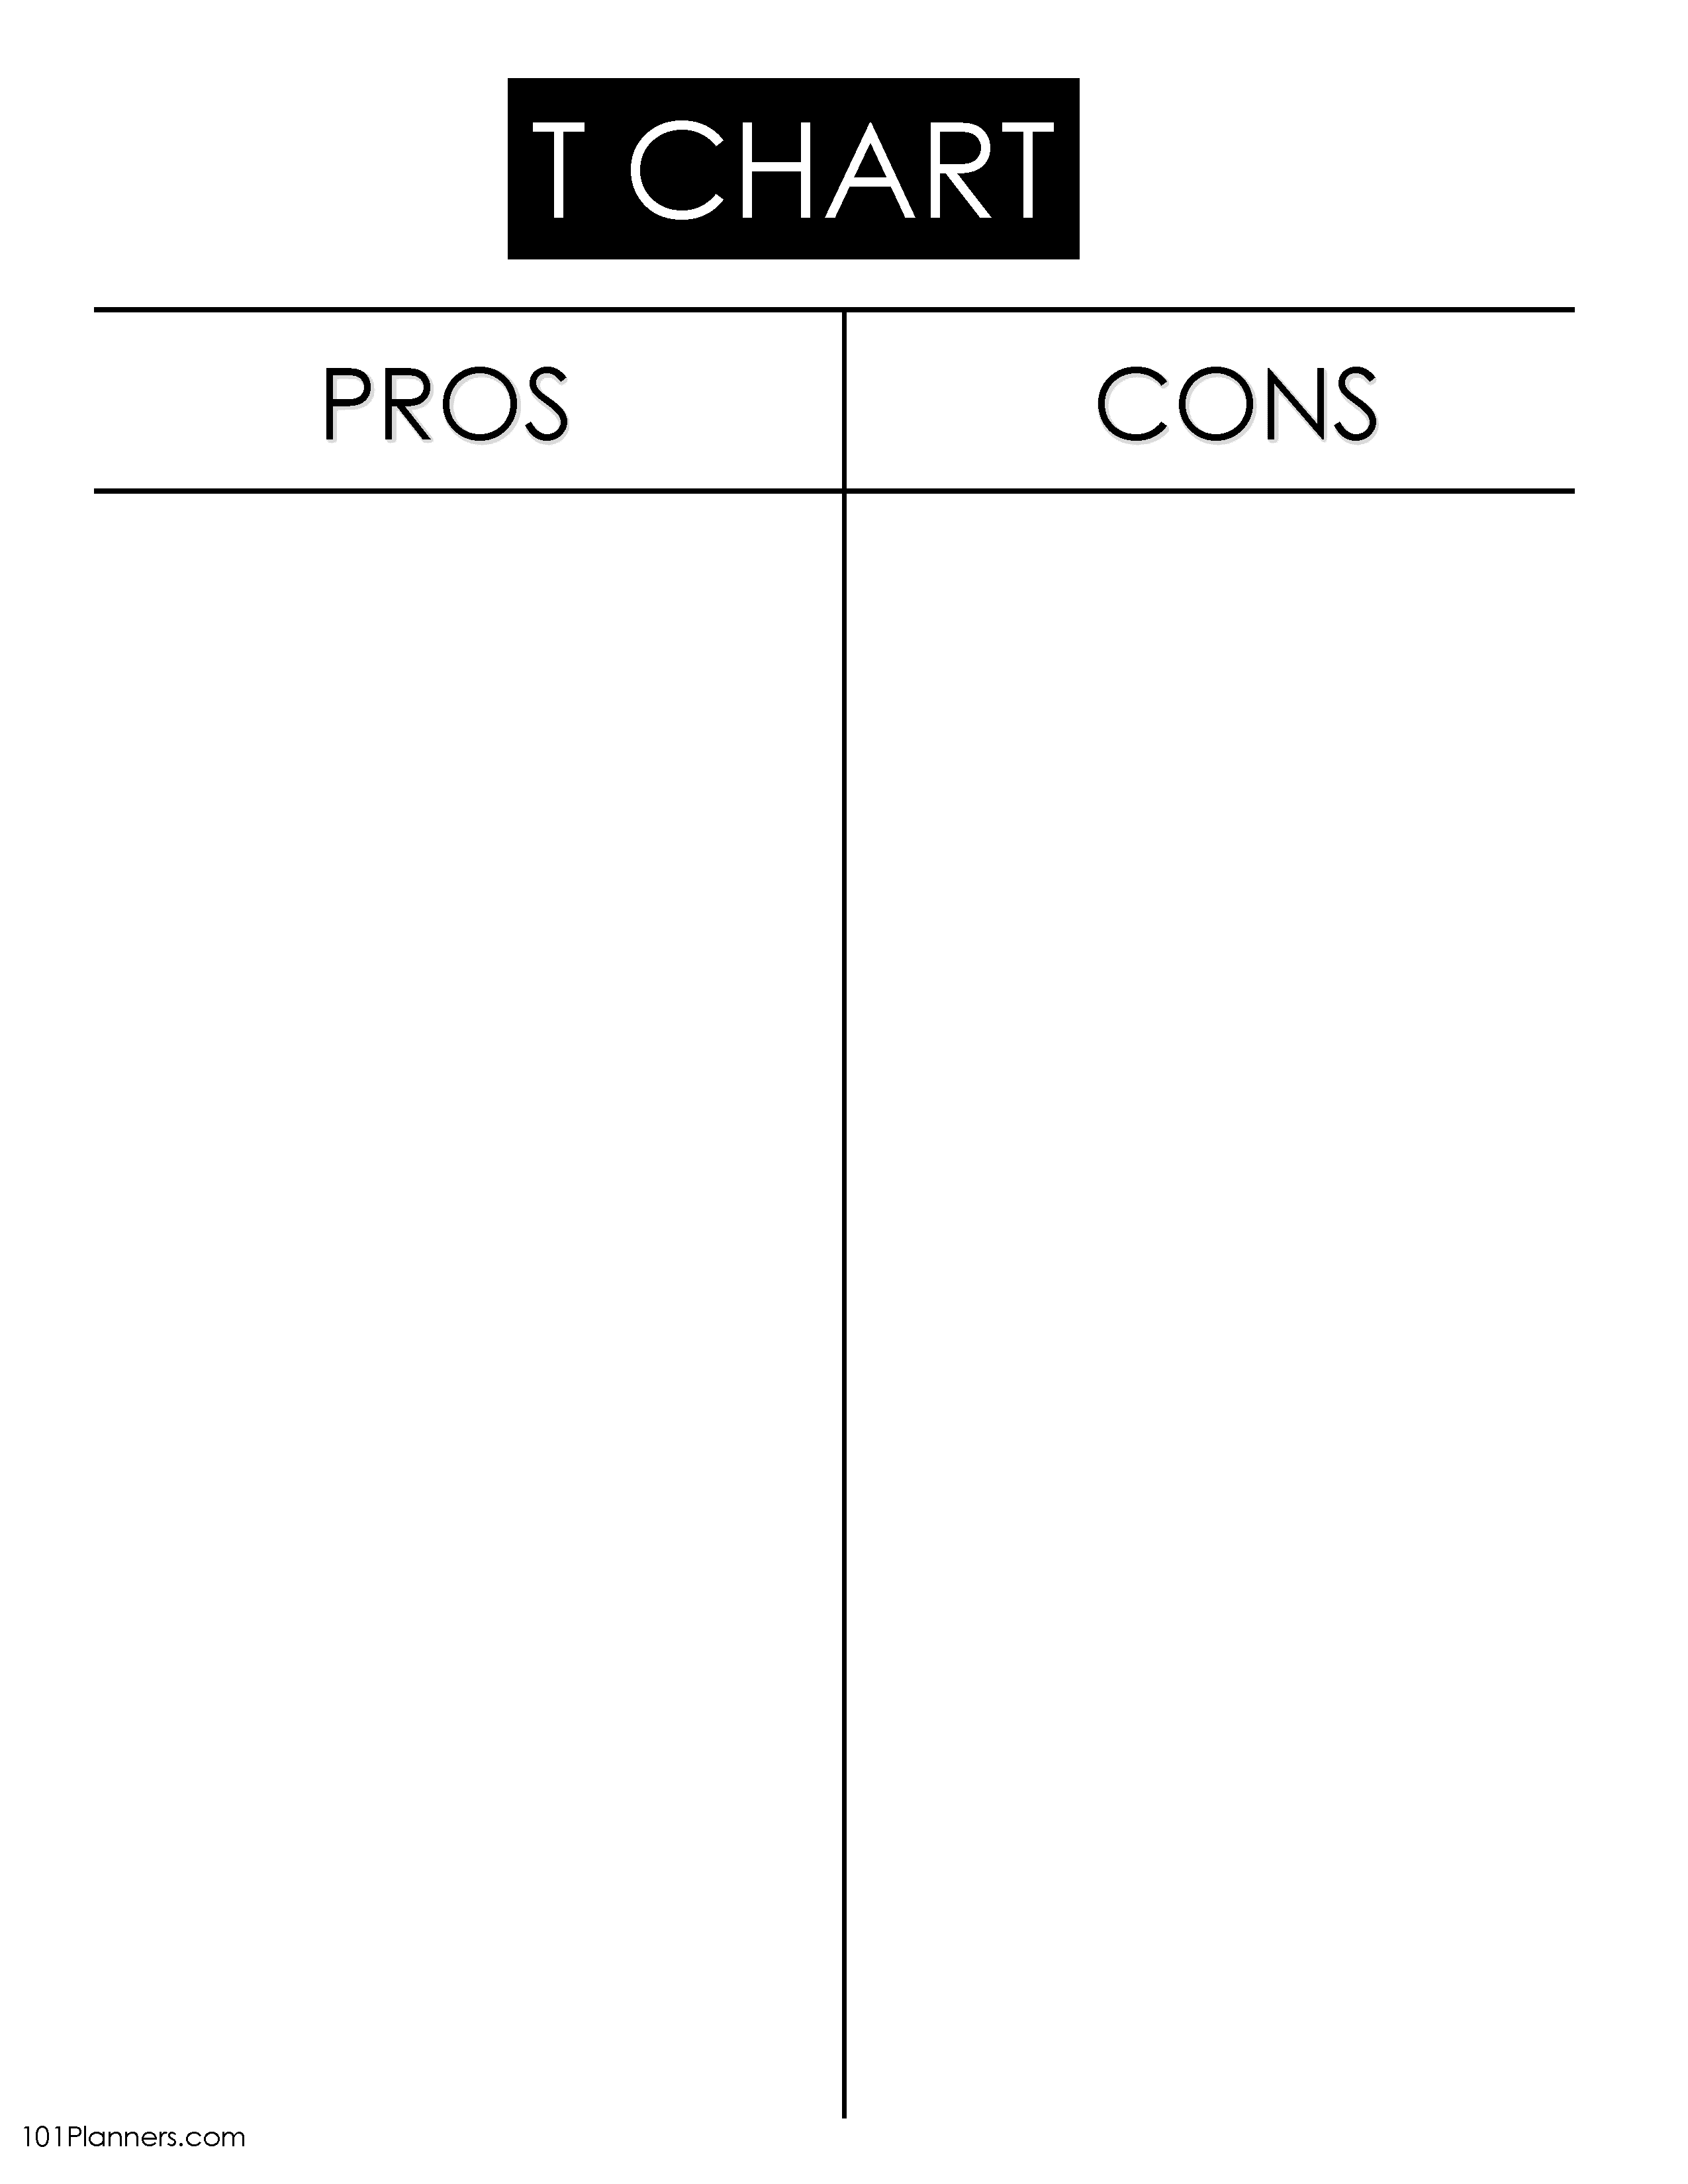
- Label the columns: At the top of the left column, write “Pros” or “Advantages” and at the top of the right column, write “Cons” or “Disadvantages.”
- Write in the chart: Use the left column to list the advantages or positives of the subject being analyzed, and the right column to list the disadvantages or negatives.
- Use bullet points: To make the chart easy to read and follow, use bullet points to organize the information.
- Be concise: Keep each item concise and to the point to avoid clutter and confusion.
 My name is